Every ecommerce site is leaking money somewhere, but the important question is where? In this post, I’ll help you to find where your leaks are by looking at a few real-life examples. One of them describes how we found a leak of $2.7 million and what we did to stop it.
One key thing to keep in mind is that “averages lies.” Benjamin Disraeli talked about “lies, damned lies and statistics,” which applies here.
Every time you look at Google Analytics data, funnels or elsewhere, you always need to think about segmenting. Always try to dig deeper. I’ll show you what I mean later in the post.
Let’s go.
Funnels: the Gold Mine
The funnels in Google Analytics are where you can find the biggest leaks on your website, and it’s probably the fastest way to find them too, if you know how to do it.
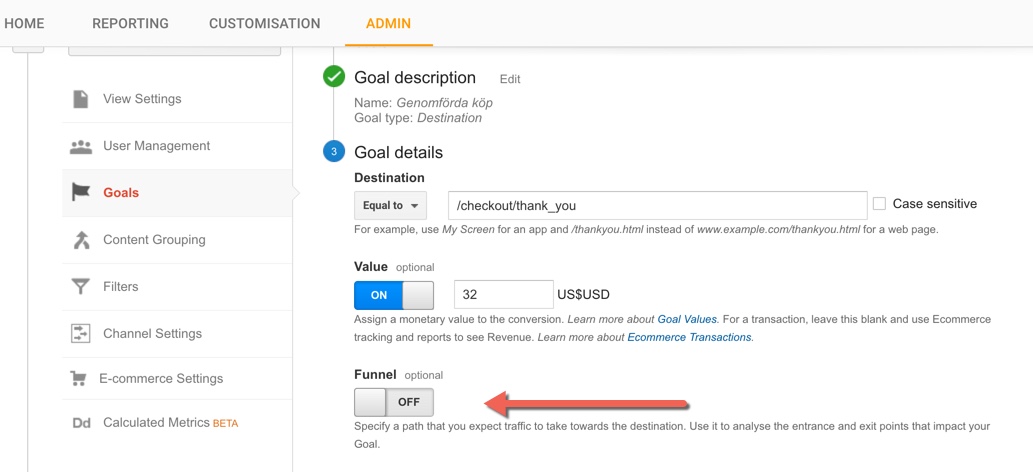
It can sometimes be a bit tricky to set up the funnels, but it is an absolute must to set them up properly. If you have not set up the funnels yet you can do so by going to:
Admin → Goals (under view) → Choose your goal and then edit “goal details.” Select “on” and insert the steps in the funnel.
If you haven’t already set up a funnel then you must calculate it manually. Go to the pages report and look at the unique page views for each funnel URL, and then you can calculate the drop off percentage for each step. More about that soon.

Make sure the funnel is set up correctly
The tricky part with installing a funnel arises when there are different URLs for different visitors. Let’s say that someone who is browsing your website while being logged in has the URL “webshop.com/logged-in/” when he/she is in the cart, while a guest that is not logged in has the URL “webshop.com/cart” in the cart. It’s the same step in the funnel but different URLs.
You’ll need to go through the funnel yourself using all possible scenarios. Go through the funnel while logged in, while as a guest, choose different kinds of shipments, etc. Write down all the URLs so you know what they look like and make sure they are in the funnel.
Also, make sure you have installed enhanced ecommerce properly.
Creating scenarios: the way to the gold mine
Many ecommerce owners have not set up funnels correctly. Among those who have, few bother to set up scenarios for the funnels; yet this it is the easiest way to find the leaks on your website and choose where to start optimizing first.
So let’s have a look at a few examples.
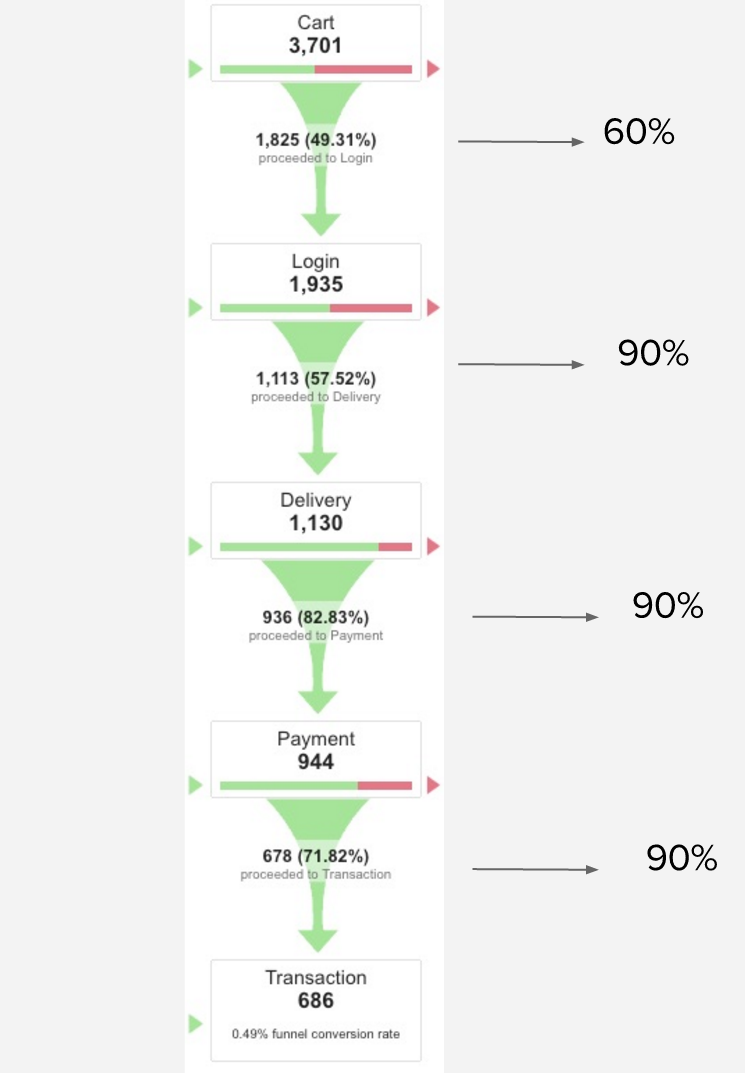
This is what a “from cart to transaction funnel” looks like for a client. The percentage shows how many visitors proceed to the next step in the funnel.
We can see there are huge drop-offs at each step. Obviously, there will always be drop-offs, but not this big.
The numbers to the right are what we know should be possible if you work on it, based on our experience.
If we only look at the last step, there is clearly something wrong here because only 71% go from payment to actually making the transaction. If we work on it, we might be able to get that number to 90%.
Look at what that number does to the revenue:
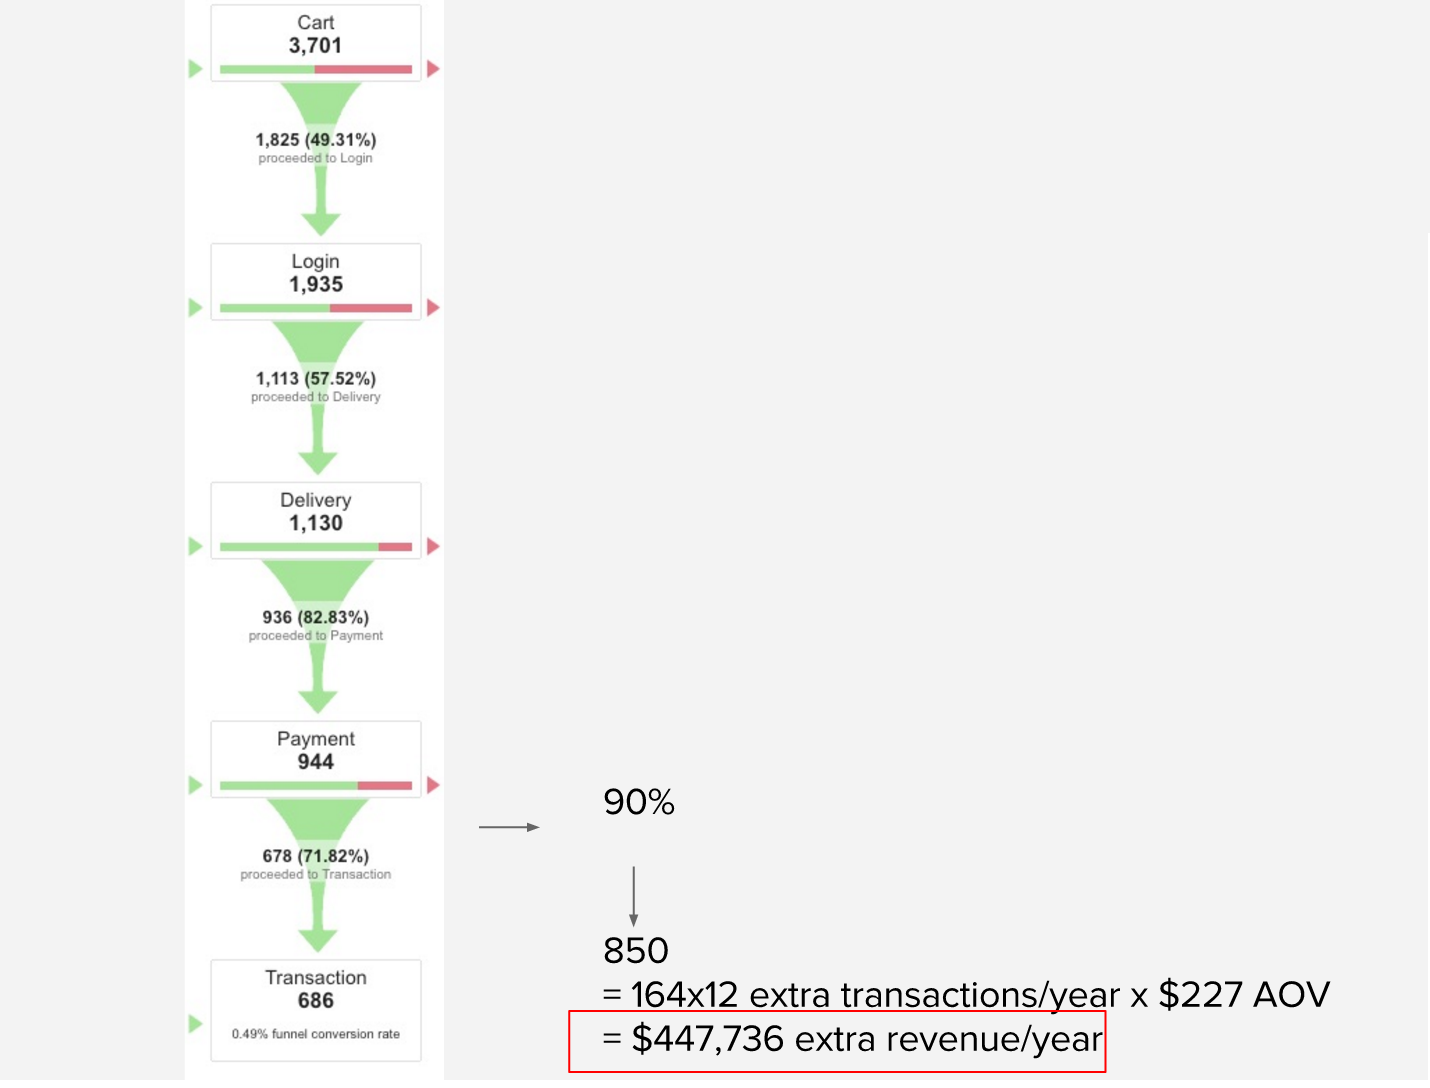
We have now found a huge leak, and we will try to find out what is wrong on that page by doing more research.
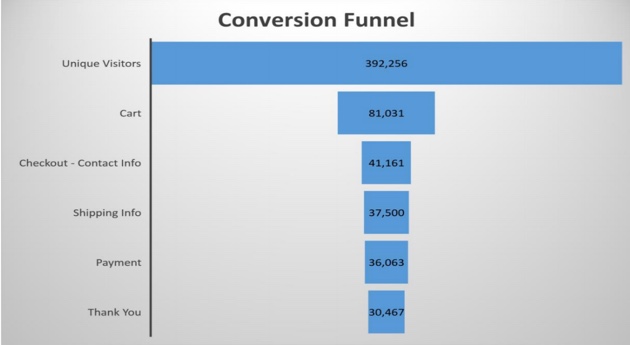
Making a manual funnel
If the funnel is not set up, you can create a “pseudo funnel” like I mentioned above by calculating each step yourself.
This ecommerce site has revenue of around $1M per year.
Let’s calculate the percentage from the numbers above:
- Site → Cart = 20% of the visitors
Just a note here: the site –> cart step is not something you can add in the Google Analytics funnel, but you can calculate it manually by just looking at the unique visitors and then at the unique pageviews of your cart page. The ratio is going to show you how many people don’t get to the point of adding a product to your cart.
- Cart → Check Out = 50% of the visitors
- Check out → shipping = 90% of the visitors
- Shipping → Payment = 95% of the visitors
- Payment → Thank you (completed order) = 85% visitors
This ecommerce site is obviously leaking money in two places here:
· Not enough visitors are going to the cart, so this number could be increased. If we could increase it from 20% to 30%, it would mean $570,000 more in revenue per year for this ecommerce (if they keep the Average Order Value the same at around $40).
- The second priority would be the Cart→ Check Out step. Here, based on our experience with other clients, it would be possible to get that to 60%, which would mean around $300,000 extra in revenue (AOV of $40).
We would start the research again and try to find out what the problems are.
Among other things, when we did some further research and segmented (remember that average lies; you always needs to segment) out the traffic by device type, we saw that the drop off for mobile users reaching the cart was much worse. Mobile users reached the cart 75% less.
Part of what we should focus on is improving the pre-cart shopping experience for all users, especially those on a smaller screen.
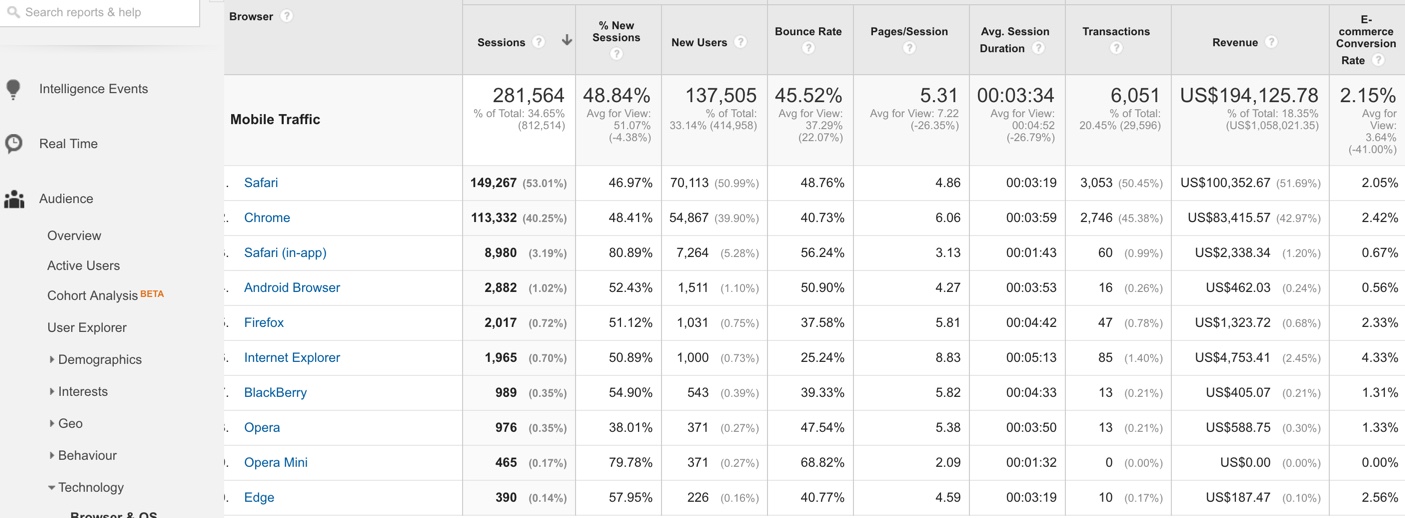
Now, if you were able to see something similar on your site, take this one step further by looking at the different browsers on mobile because, again, the truth is in the segments.
Go to Audience→ Technology → Browser & OS.
Segment out Mobile traffic on top.
Here we can see if the conversion rate is significantly lower than on others. If there are a lot of Chrome users on mobile and they convert significantly less than, for example, FireFox users, it might be that the user experience on Chrome is worse than on FF.
What you then could do is to look at the site speed for Chrome vs FF. Is the site considerably slower on Chrome for mobile than on FF? Then you’ve probably found your culprit.
If it’s not obvious right away you can dig deeper and check the site speed of the page types. Maybe your category pages load a lot slower on Chrome for mobile than on FF for mobile. If so, this could be the cause for lower conversion rates.
You can of course also check the OS of the devices and see if there are differences between them.
After this, it’s a good idea to check the user experience yourself to see if anything isn’t working properly on Chrome. You can (and should) check on the real device because it gives the most realistic feel of the user experience. Of course it’s impossible to have all devices and browser versions installed, in which case you can resort to solutions like browserstack.
Goal flows
You should also take a look at goal flows, which are a different way of visualizing your funnel. The drop-offs are not going to be as easily visible as in the funnel visualization, but goal flows have other advantages:
- They are retroactive: the problem with the funnel visualization report is that it’s only going to start collecting data starting the day you set them up. Goal flows, on the other hand, will go back in time as soon as you set your funnel up.
- You can compare 2 date ranges, which is not possible with the funnel visualization
- You can easily segment them, which is also not possible with the funnel visualization
Look at this example for instance:
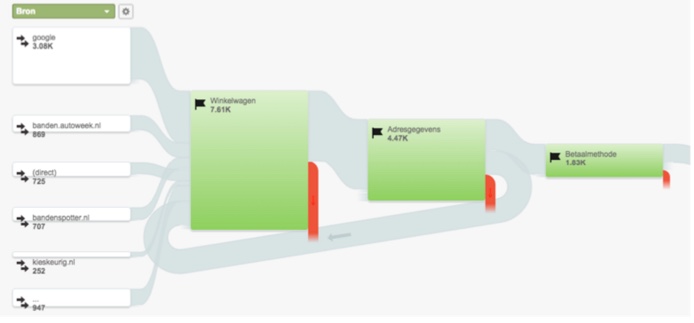
It’s in Dutch, but what it shows is a typical funnel: cart – address page – payment method. Notice anything in particular? Yes, indeed, there’s a big flow back from the address page to the cart page (see the broad gray stream that goes from right to left).
This is not exactly typical behavior. Why would people go to the page for filling in the address and then back to the cart?
You can’t tell with certainty from the Google Analytics data alone, but it could mean that there’s some information missing in the cart that people are looking for on the address page, don’t find, and then decide to go back.
Your Google Analytics data can’t tell you what exactly the problem is, but now you know you’ve got a problem here. You should use other research methods to figure out WHY people are behaving like this on this step so you can start coming up with a solution that fits the problem.
The $2.7M / year example
Let’s look at another case, and I’ll tell you how we found the leak and what we did to stop it.
This is a national company that partners with many local shops. The company sells a product that can be delivered in three different ways.
When we started working for this client, we took a look at a funnel like those I just talked about and discovered that they were losing $2.7M on one particular page in the check out: the page where the visitors fill in the address.
On this page, the visitor was given three choices by the company:
- deliver the product to you and you install it yourself
- You go to a partner’s local shop and they will install it for you
- We deliver the product and install it
The majority of their orders were the first “do-it-your self (DIY)” option . That could mean two things:
- The company mainly attracts the DIY type of visitor
- The company doesn’t succeed in convincing the second and third type of visitors to buy
How we did the research
We started testing different things and restructuring the checkout flow to see if we could get an increase in conversions, but we could not. What we did figure out through the testing is that we mainly had visitors that wanted to choose option 2, to go to a partner’s local shop and have someone there install the product for them, but they somehow dropped off later in the process.
This was a very important breakthrough because before that the client just assumed they attracted mainly DIY type of visitors. It turned out that over 60% of the visitors actually wanted option 2, but the company just didn’t succeed in converting them.
This is an example of how a test can give very important facts, even if there’s no conversion lift. We kept the checkout so we could focus on improving the process for the second type of visitors.
More research
Next, we did additional research: we analyzed click maps and watched a few hundred visitor recordings. A few tools you can use for click maps and recordings: Crazyegg, Mouseflow, Clicktale and Lookback.
From that we got the hypothesis that choosing the local partner shop (option 2) made the process more difficult. here was the paradox of choice problem.
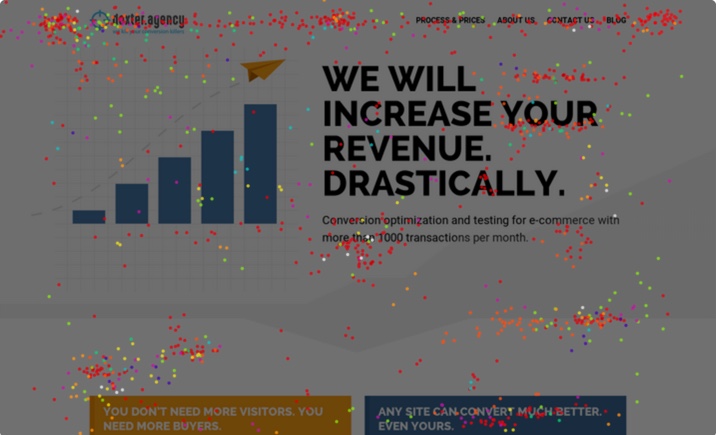
(Example of a click map)
Based on that research, we did an important test: we removed the choice. Visitors could no longer choose which local shop they could go to.
Instead, they had to fill in their postal code and the website told them where they had to go. This seems simple, but it changed the way they do business and required a lot of changes to the site. We even ended up testing two separate versions of the site (not just two pages) because there were too many different page types where the partner;s local shops were mentioned.
The new version of the site increased the conversions around 20% and that was just the beginning. We also found many other reasons why the funnel was leaking, including site speed and pricing issues.
But it all started with the funnel and the scenarios.
Conclusion
Looking at your funnels and setting up scenarios is the fastest way to find the leaks on your website. Make sure the funnels are set up correctly and that you then set up scenarios to find where your site is leaking the most money and you’ll know where to start.