Google Analytics is an incredible tool if used correctly. Last month I watched Annie Cushing at ConversionXL Live and she pointed out a whole slew of Google Analytics mistakes companies make:
Every good conversion rate optimization expert knows how to get knee-deep in Google Analytics data.
Peep Laja constantly stresses the importance of data and using that data to pinpoint where your website is leaking money.
Google Analytics is a simple tool but can be overwhelming for most ecommerce store owners who don’t have a digital marketing background.
Not all ecommerce store owners can invest 40 hours a week in learning every Google Analytics/Universal Analytics feature. But if you can take 5 minutes to read this article and then allow 30 minutes a day for applying your learnings to your ecommerce business, you’ll see your conversions skyrocket in no time.
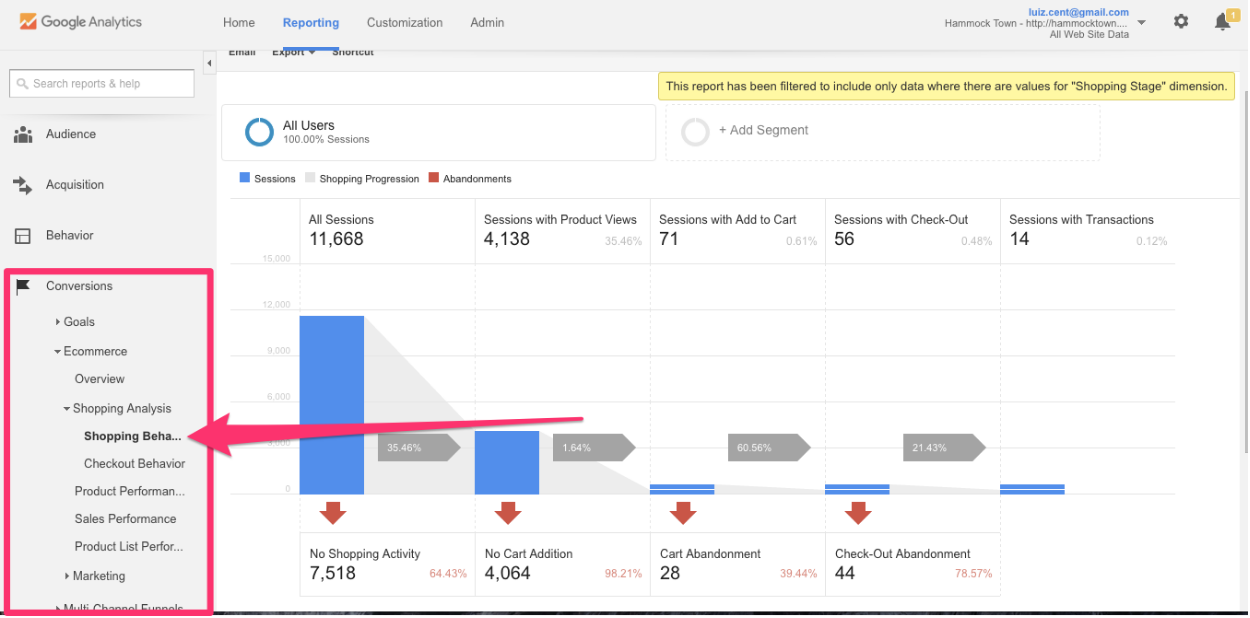
1. Ecommerce Funnel Visualization
What is funnel visualization? It allows you to identify how customers are flowing through your site.
If you have a typical ecommerce site you’ll have your Homepage -> Category Pages -> Product Detail Pages (PDP) -> Cart – > Checkout Flow -> Order Confirmation (Conversion)
Funnel Visualization will help you identify the weak links in your checkout process. Roughly 70% of your customers are abandoning your shopping cart without actually making a purchase.
By analyzing your ecommerce funnel, you’ll be able to identify if customers aren’t converting to the cart from the PDP (Product Detail Pages) or if there is a huge drop-off on step 3 of your 5-step checkout.
About a year ago, you would’ve had to do this entirely through goals and funnel visualization, but the latest updates from Google Analytics allow you to evaluate shopping behavior if you have enhanced ecommerce setup.
If you don’t, it will take you 15 seconds.
If you identify a flaw in your conversion funnel, you can use a platform like Experiment Engine and/or Optimizely to A/B test your pages.

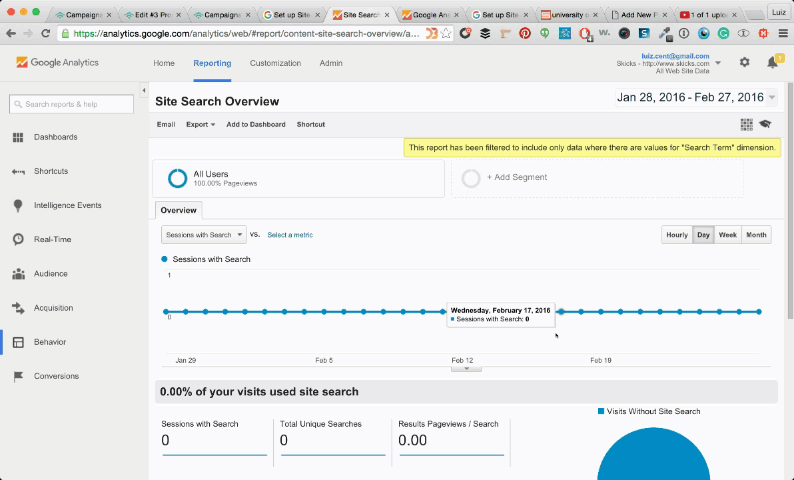
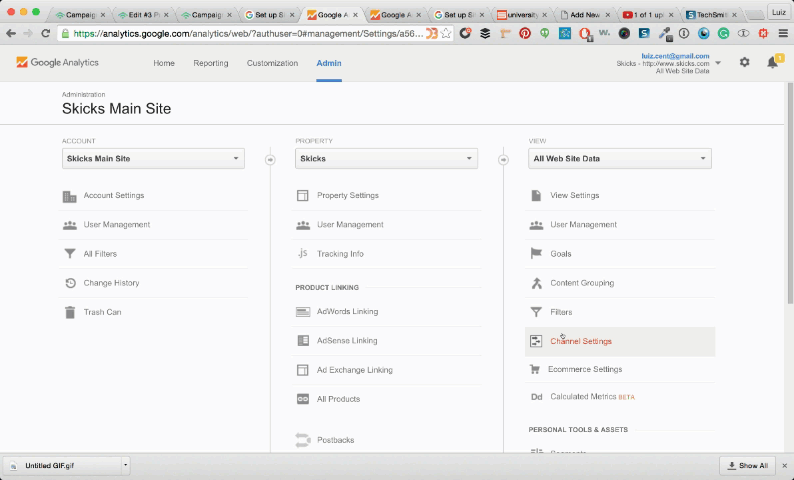
2. Site Search
I was working with a client who didn’t even have search installed on their site. I suggested they A/B test it, but they went ahead and implemented it without even telling me!
The fun part was that their developers never set up site search to show data in Google Analytics, so they couldn’t even see if people were using site search.
After installing site search, we were able to identify areas where their merchandise was lacking. If people were searching for “orange” and they didn’t have anything in orange, the customers obviously aren’t going to convert and no headline/CTA change will fix that.
But now they know they need to invest in “orange” merchandise.
If you already have site search installed and it’s triggering data into GA, it’s real easy to see that valuable data.
To see site search data in Google Analytics:
- Sign in to your GA account.
- Navigate to your desired account, property, and view tab.
- Select Behavior > Site Search.
To Set up Site Search in Google Analytics:
- Sign in to your Google Analytics account.
- Navigate to a view that you want to set up Site Search. (Each view needs a new site search set up.)
- Navigate to View Settings.
- Scroll to the bottom where you see Site Search Settings and set Site Search Tracking to ON.
- Enter your site’s Query Parameter in the field below. It might be a term like “term,search,query”. Often it’s just a letter, such as “s” or “q”.
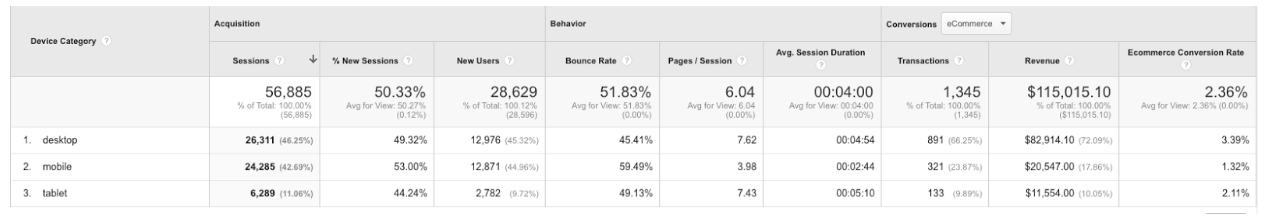
3. Audience Mobile Tracking
Since you already have conversion tracking installed, take a look at your mobile analytics. Everyone talks about investing in mobile first, and mobile traffic dominates desktop traffic in nearly all my properties , yet…desktop traffic converts so much better.
Shopify did a study of their properties 2 years ago and in 2014, mobile surpassed desktop traffic for them!
 Nearly every client I talk to wants to get their mobile conversions up to par to their desktop conversions. But this shouldn’t always be your goal. Sometimes conversions aren’t possible with mobile. Brian Massey & the team at Conversion Sciences understood this and ran a brilliant experiment.
They took a step back and got a deeper understanding of their client’s customer. In this case eSigns.com built a great tool that would allow customer to design their own custom signs and banners! The problem is on a mobile device this usually lead to a very frustrating experience. Rather than force the customers through that, they had them email themselves a link to continue their design on desktop!
Rather than thinking how can to get that 1.32% conversion rate to a 4% conversion, think about how to create a seamless experience from mobile to desktop.
4. Audience Browser Tracking
Have you asked yourself these questions?
- What browsers are your customers using?
- What browsers are they converting on?
- Are customers experiencing issues on certain browsers that you can easily fix to increase conversions?
Once you answer these questions you’ll be able to identify if there are any pressing issues with certain browser types.This is something I learned from Peep Laja and it’s worked WONDERS.
When we get a new client, we’ll analyze their conversions by browser and identify issues by browser type or browser version.
Here, we can analyze a huge conversion decrease where Chrome version 50.0.2661.89 is converting at 1.61% compared to version 50.0.2661.102 which is converting at 3.24%.
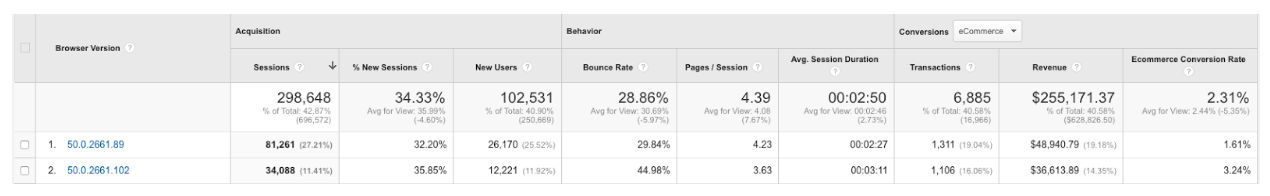
This was a simple fix where we identified a bug on the shipping policies page, and the fix we implemented made the customer an extra 10k a month!
Another example of this is The Design Improvement That Wasn’t. Patrick McKenzie shared his experience with an A/B test that cost him more than a month’s salary.
“Pesky IE 6/7 removed the “Sign Up” button.”

How well do sign-up forms convert without CTAs?
Not well at all.
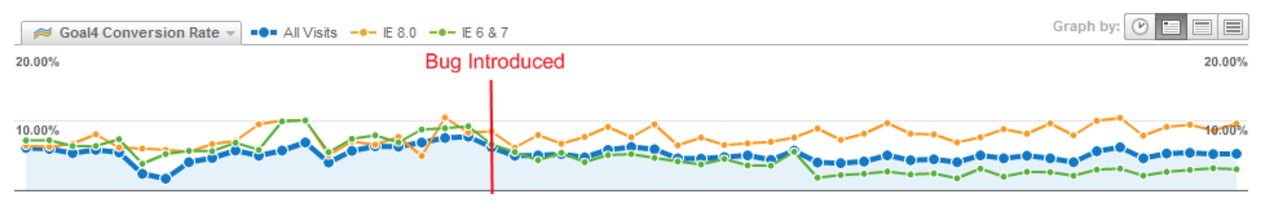
To prevent this monitor your audience browser conversions, especially when updates to browsers are released.
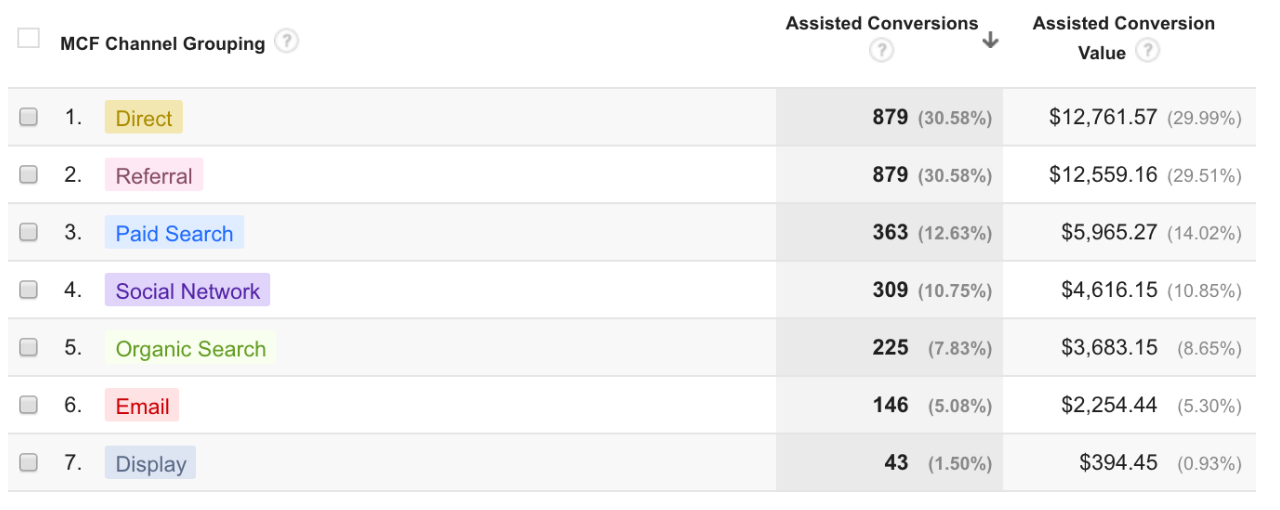
5. Multi-Channel Funnels
Where are your sales coming from? Every ecommerce store should know this, but a surprising number of eTailers have no idea.
The first thing I do when I begin working with a new client is help them identify which channels are working and which ones are futile.
Investing more resources in better-performing channels is a no-brainer. It’s all about ROI; increase the R and decrease the I.
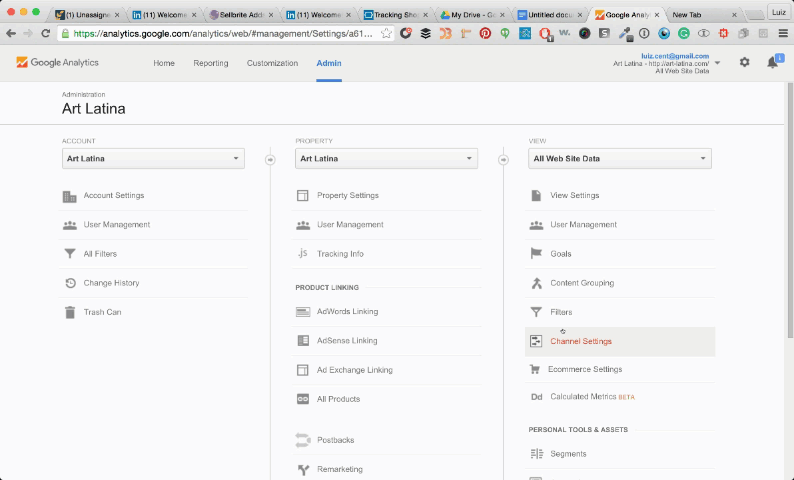
This is super easy to set up and analyze. Go into Conversions -> Multi-channel Funnels.
You’ll be able to analyze assisted conversion, top conversion paths, time lag, and path length.
Assisted conversions in layman’s terms are all the interactions a customer has with a website leading up to a conversion except the final interaction. Perhaps a customer discovered you through organic search but made the final purchase via email.
Assisted conversions helps you give credit to organic as a contributor to that conversion.
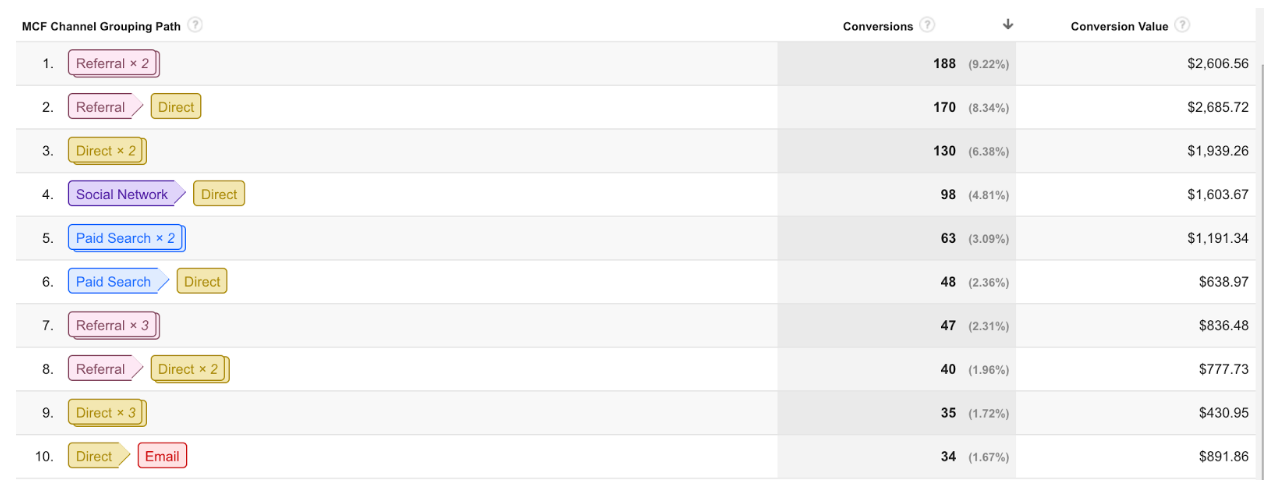
Top Conversion Path. The Top Conversion Path report shows all of the unique conversion paths that led to conversions. You’ll be able to identify the number of conversions from each path, the value of those conversions, and how channels interact along your conversion paths.
Exciting Stuff!
In Conclusion
You can implement and analyze all these features in Google Analytics, but unless you think about how they are actually impacting your business, it won’t do you any good.
Note that all the top ecommerce stores are constantly evolving and they are always testing to create better user experiences, increase conversions, and revenue per visitor.
If you don’t have your first A/B test up and running, you can do so in under 15 minutes.
Have you had any other interesting insights on conversion you got from analyzing GA data? Please share them in the comments below, and we’ll keep learning from each other!

21 thoughts on “5 Advanced Google Analytics Features That Will Skyrocket Your Ecommerce Conversions”
Hey everyone, thanks for reading. I’m around if you have any questions about the article or if you want to mention an additional GA feature you love to use, I’d be thrilled to hear about it.
Dude – I gotta use some of these. Pure genius!
Thank you sir! Spending 30 minutes a day in GA will lead you to conversion gold mines. 🙂
Hey Luiz,
This is a great post also for solopreneurs looking for ways to track data and their sites performance on browsers, mobile, and site search. I check this data once and a while and it helps to see what problems I have so that it gives me an idea of what to focus on.
Thanks for sharing!
Hey Sherman!
Thanks for reading, and for leaving a comment. I’m so glad you found it useful and hope it will help increase your conversions.
Hi Luiz,
An informative post indeed.
There are many people who try to explore the Google Analytics. The features to know the users browser is great and the search website. I use it many times.
The stats showing the type of links to your website. Whether you have th inbound links or others.
Glad to read the post.
Enjoy the day.
~Ravi
Thanks Ravi! Glad you found this helpful 🙂
Comments are closed.