Merchants on online marketplaces need to stick to each platform’s rules to be successful. An Amazon seller can’t win the Buy Box without matching the site’s algorithms. Products on eBay rank higher in search results if they come with free shipping.
Online store owners have more influence over their customer acquisition and engagement since they control everything about their shop. They have no marketplace rules to abide by, so they can make changes directly based on data insights to help them sell more.
Sellers can start taking advantage of their online store’s data with Google Analytics. We’ve created this guide to explain:
- How to connect Analytics to your online store
- Where to find key growth metrics on Analytics
- How to use this data to improve customer acquisition and engagement
Online store owners can drive more purchasing opportunities by tracking metrics with Analytics and making improvements. Monitoring these figures empowers sellers with data-backed knowledge to reshape their business practices and boost new and returning customer sales.
How to set up Google Analytics on your online store
In order to understand your store, you need to measure it quantitatively. Merchants who are selling on their own online store don’t have built-in tools—like the ones major marketplaces provide—to measure their activity.
Instead, online store owners can set up Google Analytics to track metrics and grow their business with data-based strategies.
Start by registering on the Google Analytics site. Signing up is free.
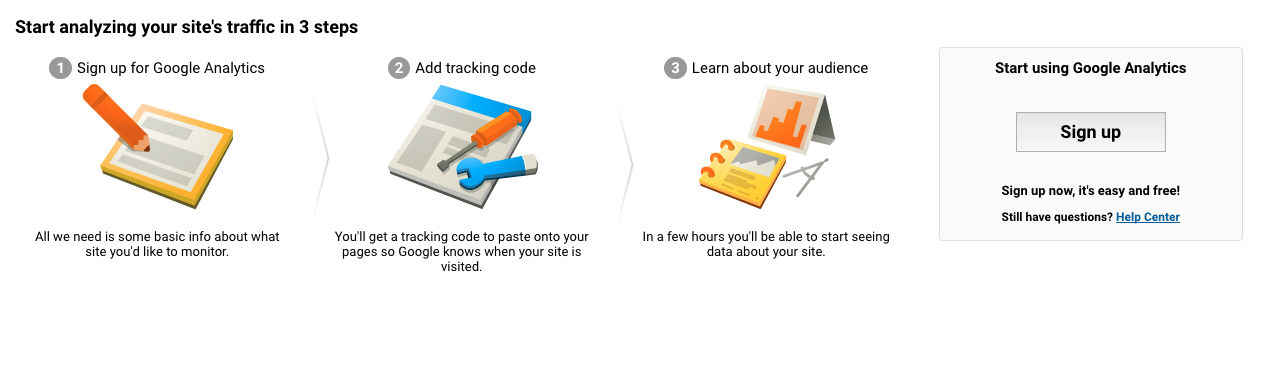
After you click “sign up,” you’ll be redirected to the New Account page. Make sure it’s set to Website, and then fill out your online store information.
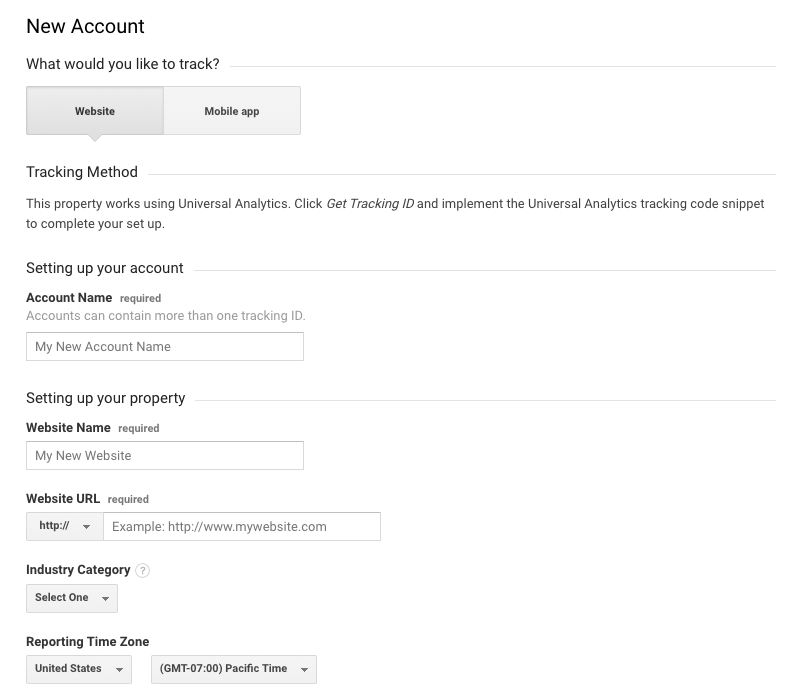
Select Get Tracking ID at the bottom of the page.
![]()
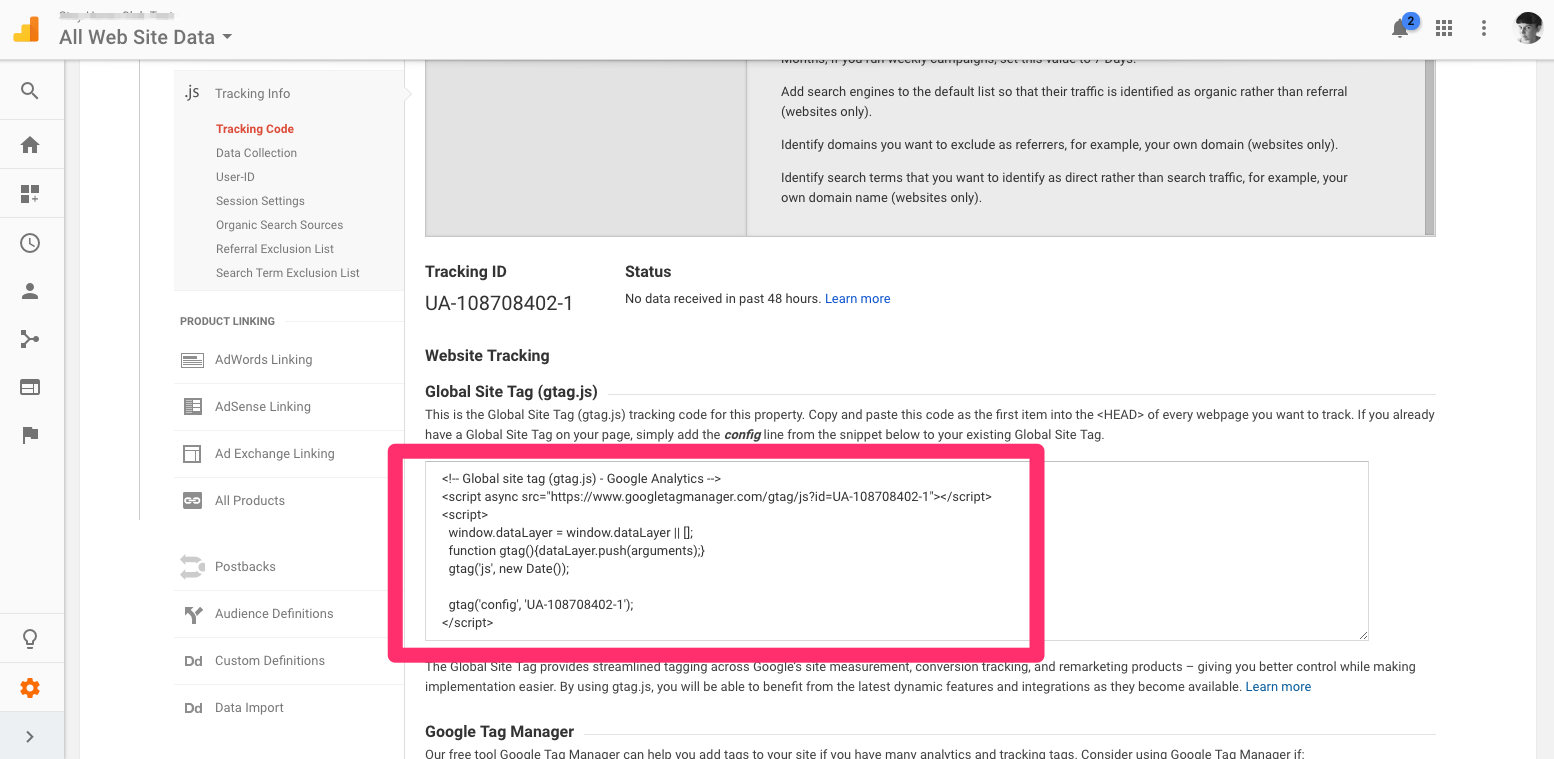
When you accept the Terms of Service Agreement box that appears, you’ll be redirected to the Tracking Code page. Copy the Global Site Tag tracking code and paste it right after the opening <head> tag on each webpage you want to track.
If you already have a Global Site Tag on your page, add the config line from the tracking code snippet to your existing Global Site Tag.
Ecommerce platforms, such as Shopify and BigCommerce, typically have additional instructions for pasting the code on their enabled online stores. WordPress, GoDaddy, and Wix also have separate instructions for setting up Analytics. Merchants using these platforms should refer to their sites for additional instructions.
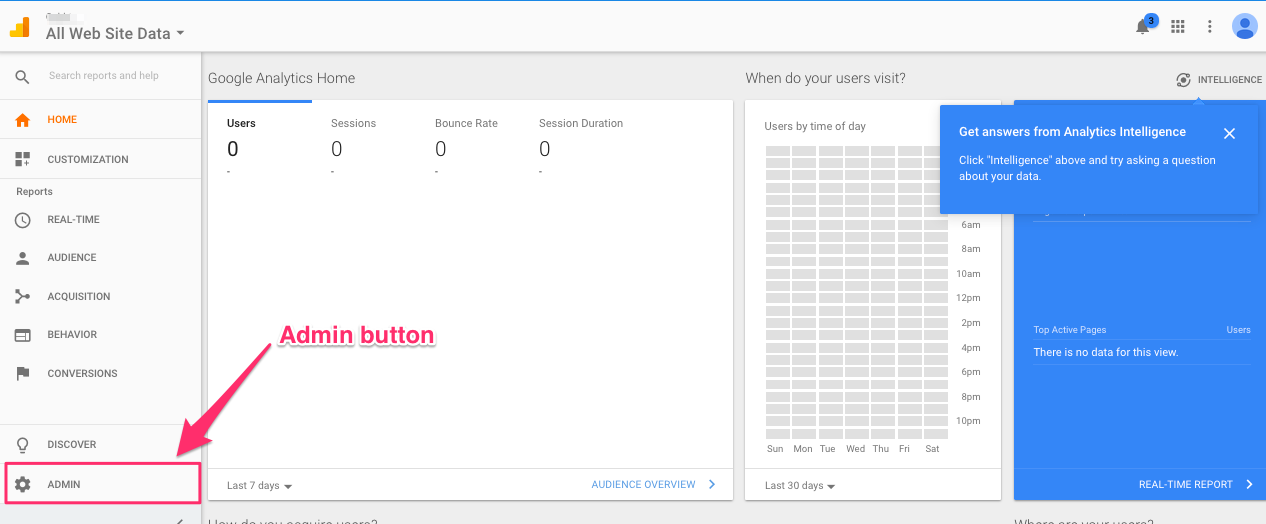
The next step is turning on Ecommerce Tracking in Google Analytics. From your main view, click the Admin button in the bottom left-hand corner.
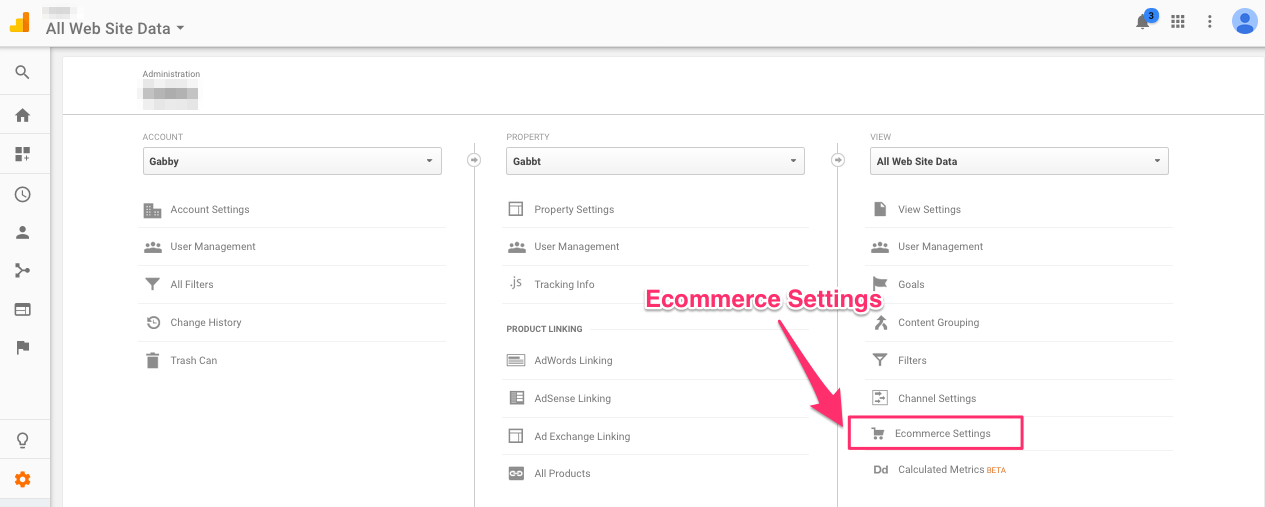
Under the View column, select Ecommerce Settings.
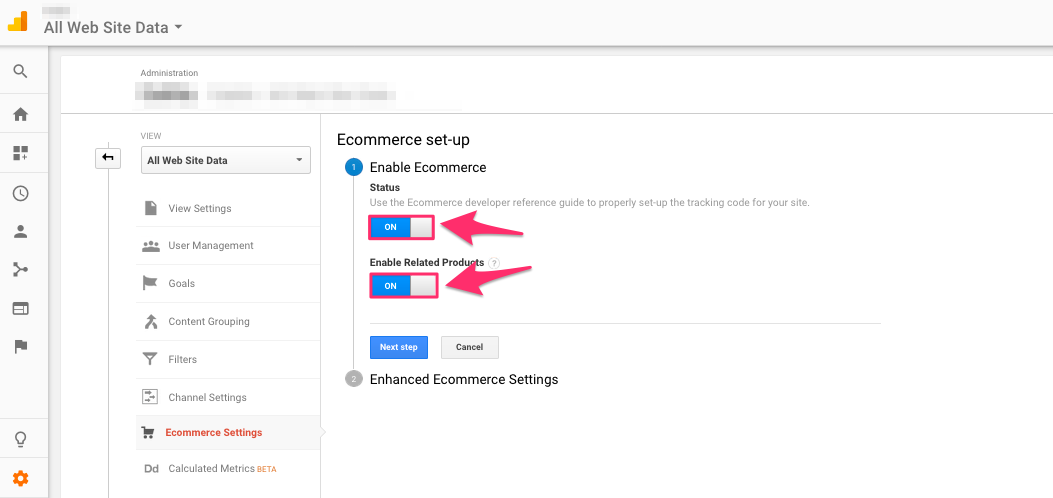
Enable Ecommerce Tracking by turning on Status and Enable Related Products, a feature that shows similar products to your own on your online store.
Once you click Next Step, enable Enhanced Ecommerce Tracking, which provides additional data around user behavior.
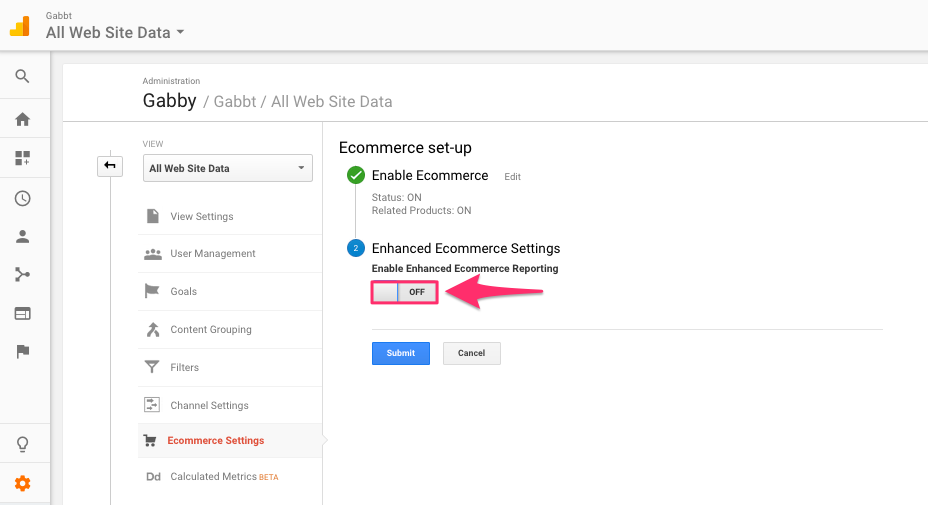
Select Submit, and Google Analytics will begin tracking ecommerce metrics for your online store.
How data impacts growth on your online store
The likelihood of buyers purchasing products on your online store depends on:
- The distribution of your marketing: where your marketing is presented
- The content of your messaging: what you communicate to potential customers through different channels, such as site pop-ups and promotional emails
- Your online store design: the layout and aesthetic of your online store
- Your pricing: the prices you charge for products and shipping
Online store owners can adjust each of these factors with data-backed insights to help drive returning and new customers to purchase.
We’ll cover how these growth factors are shaped by Google Analytics data. Later down below, we’ll explain where to find these metrics in reporting.
Distribution of your marketing
It doesn’t matter how well-written or well-designed your marketing is—if your campaigns aren’t distributed where customers are looking, they won’t have any impact on purchasing decisions. Marketing is only effective if it’s shown in customers’ preferred channels.
Sellers can measure the performance of online channels by tracking their ecommerce conversion rates. This metric indicates the percentage of store visitors from each channel that converted to buyers. Channels with high volumes of converting visitors are valuable for merchants—and that’s where merchants should focus more of their marketing.
Another metric to check to measure channel performance is revenue. Channels that generate high income should be targeted for growth. For example, a seller might double down on Facebook ads if they see that social networks are a high-conversion, high revenue channel.
Need a quick review? Here are the metrics we covered in this section:
- Ecommerce conversion rate (by channel)
- Revenue (by channel)
Content of your messaging
Companies’ messaging resonates with buyers when it’s curated to specific customer types. Online store content and promotional materials that speak to specific buyers’ needs and wants are engaging. Relevant content is more likely to encourage purchases.
Analytics can be used to understand the behavior of each customer type and inform your buyer messaging to make it more individualized. Sellers can choose which types of customers they want to track by setting up Segments, which are subsets of buyers. Segments can distinguish buyers by a wide range of factors, such as purchasing behavior, geographic location, and technology usage.
These buyer categories are used to organize Analytics data. With metrics organized by Segments, sellers can determine how to target and attract each customer type with their messaging. Merchants can learn more about setting up Segments here and find recommendations for Segments here. Sellers also have the option of using Google’s pre-set reporting categories, such as new versus returning customers, instead of Segments.
Once merchants have set their customer types, they should monitor each buyer group’s behavior on their online store. Understanding where specific customer types are losing interest helps merchants understand how they should revamp their site messaging to keep buyers engaged. This could mean editing pop-up announcements and page headers, or adjusting the copy on the homepage.
Sellers can analyze customers’ online store behavior by tracking their bounce rate and average session duration. The bounce rate indicates the percentage of single-page sessions that involved no interactions, and average session duration indicates the average length of a session. Buyers with high bounce rates and low average session duration amounts need to be engaged further with improved site messaging to encourage more purchases.
Merchants should also track the revenue and ecommerce conversion rate for each customer type. These two metrics measure how valuable a buyer group is by indicating the amount of income they generate and how likely they are to make a purchase when visiting a store. Understanding how valuable a customer type is with this data helps sellers determine whether the buyer group is worth targeting and how their messaging should be changed to be more relevant.
Need a quick review? Here are the metrics we covered in this section:
- Bounce rate (by visitor type)
- Average session duration (by visitor type)
- Revenue (by visitor type)
- Ecommerce conversion rate (by visitor type)

Online store design
Humans are visual creatures — we process images in less than a tenth of a second and half of the brain is involved with processing visuals. Your online store’s design is critical given the power of visuals. A store’s layout and aesthetic can encourage or discourage a buyer from making a purchase.
The likelihood of a sale is affected, for example, by the layout of an online store’s shopping cart feature and checkout flow. Merchants can determine whether they need to revamp their cart design, checkout process design, or both by tracking the following metrics:
- No cart addition rate: the percentage of customers who viewed a product but did not add it to their cart
- Cart abandonment rate: the percentage of customers who added a product to their cart but left without starting the checkout process
- Checkout abandonment rate: the percentage of customers who began the checkout process but did not complete their purchases
These metrics indicate where merchants are losing sales. Sellers with high no cart addition and abandonment rates should consider how their online store’s cart or checkout designs can be improved. Small changes, like changing the placement of a button, can create a more intuitive customer experience.
Merchants can also assess how their online store’s design is impacting purchases by checking their store pages’ views and bounce rates. Knowing how frequently potential customers visit and interact with certain pages allows merchants to identify where site content should be revised for better engagement. If pages have low views and high bounce rates, potential buyers could lose interest and leave your store without making any purchases.
Need a quick review? Here are the metrics we covered in this section:
- No cart addition rate
- Cart abandonment rate
- Checkout abandonment rate
- Page views
- Page bounce rates
Product price
The price of your products is perhaps the most influential factor in buyers’ purchasing decisions. Consumers are savvy and know that there are plenty of alternative shopping options online. Merchants have to constantly check competitors’ prices to make sure their rates are competitive enough to attract buyers.
Sellers can assess whether their product prices are discouraging purchases by tracking two metrics:
- The cart-to-detail rate: percentage of product views that resulted in adding products to carts
- The buy-to-detail rate: percentage of product views that resulted in purchases
Merchants can use these metrics to consider whether and where they need to reduce pricing to incentivize purchases. Low cart-to-detail rates may mean that your product price is too high for most buyers, while low buy-to-detail rates could mean that additional checkout price factors, like shipping costs, are also discouraging purchases.
Need a quick review? Here are the metrics we covered in this section:
- Cart-to-detail rate
- Buy-to-detail rate
Now we will get into tracking data on Analytics.
Tracking data on Analytics
Sellers have to know where to find the metrics that impact their marketing, store design, and product price decisions in order to improve customer engagement and conversion.
This data can be found in five types of Google Analytics reporting.
- The Audience report includes the following visitor type metrics:
- Bounce rate
- Average session duration
- Revenue
- Conversion rate
- The Acquisition report includes the following channel metrics:
- Conversion rate
- Revenue
- The Behavior report includes the following page metrics:
- Page views
- Page bounce rate
- The Conversions report includes the:
- No cart addition rate
- Cart abandonment rate
- Check-out abandonment rate
- Cart-to-detail rate
- Buy-to-detail rate
We’ll identify where to find each of these metrics in Google Analytics so that sellers can identify opportunities for improvement.
Audience report
The Audience report provides insights on how different types of buyers are interacting with your online store. It is the second report located on the left-hand sidebar.
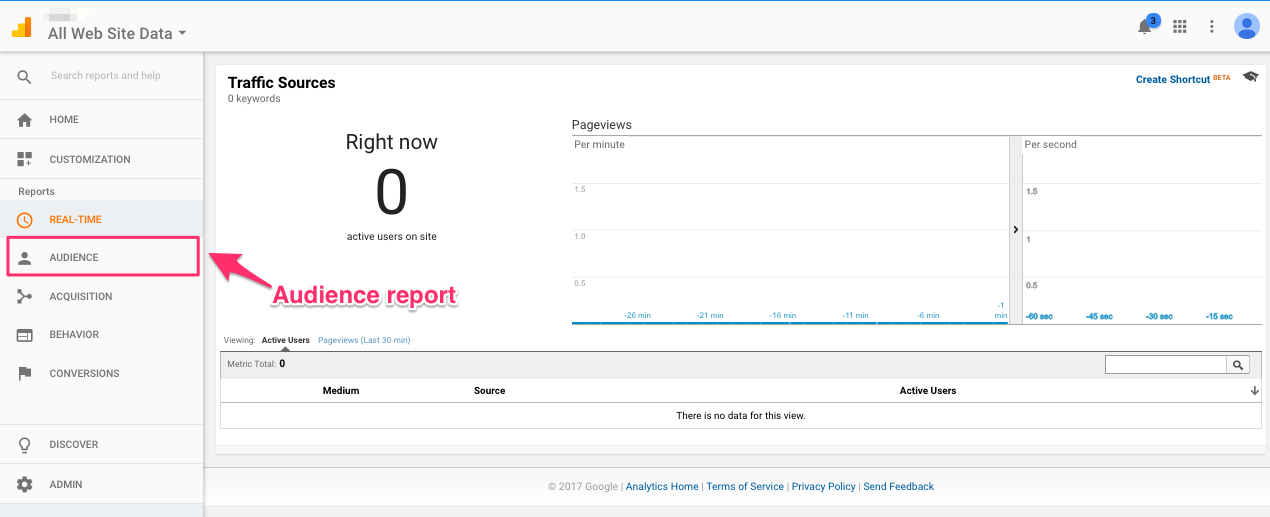
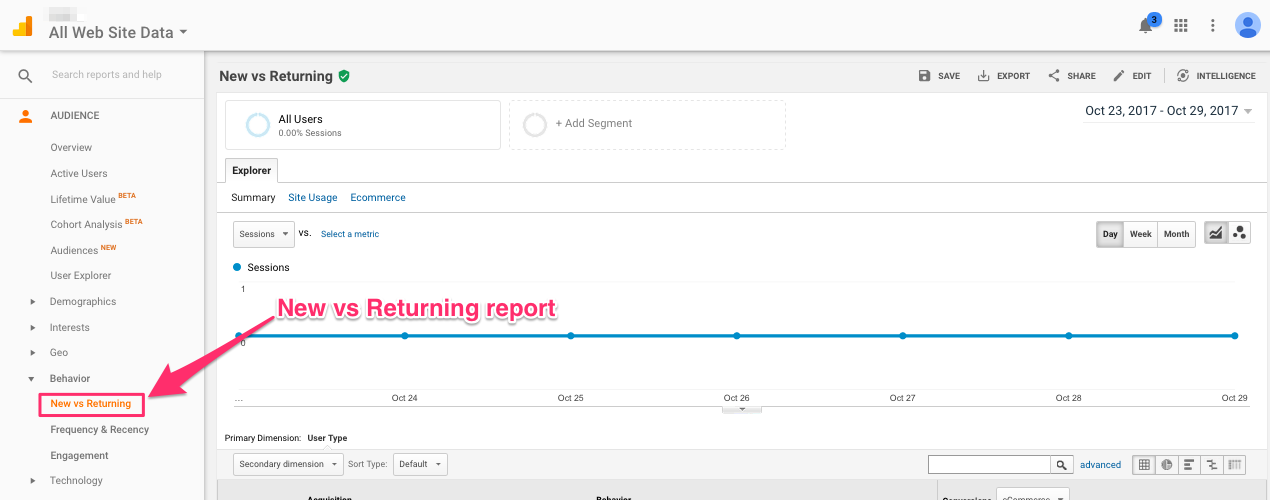
Merchants can view the customer type metrics by clicking the New vs Returning report under the Behavior subsection of the Audience report.
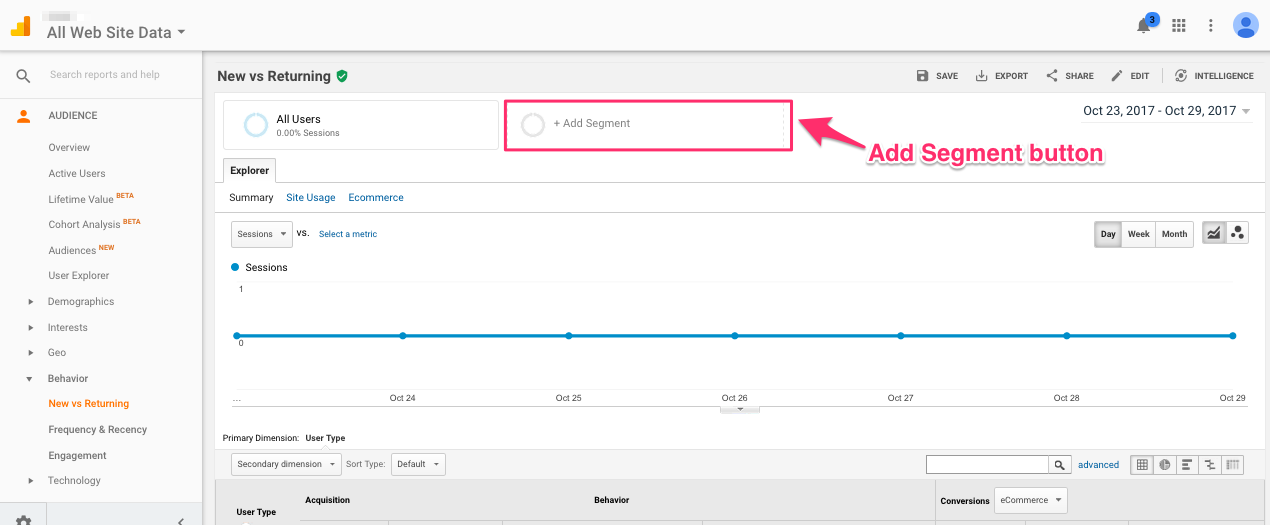
The report is pre-set to indicate metrics for new and returning customers, but merchants can easily add segments for different customer types at the top of the page. Google Analytics allows users to add pre-built Segments or custom Segments for analyzing different customer types.
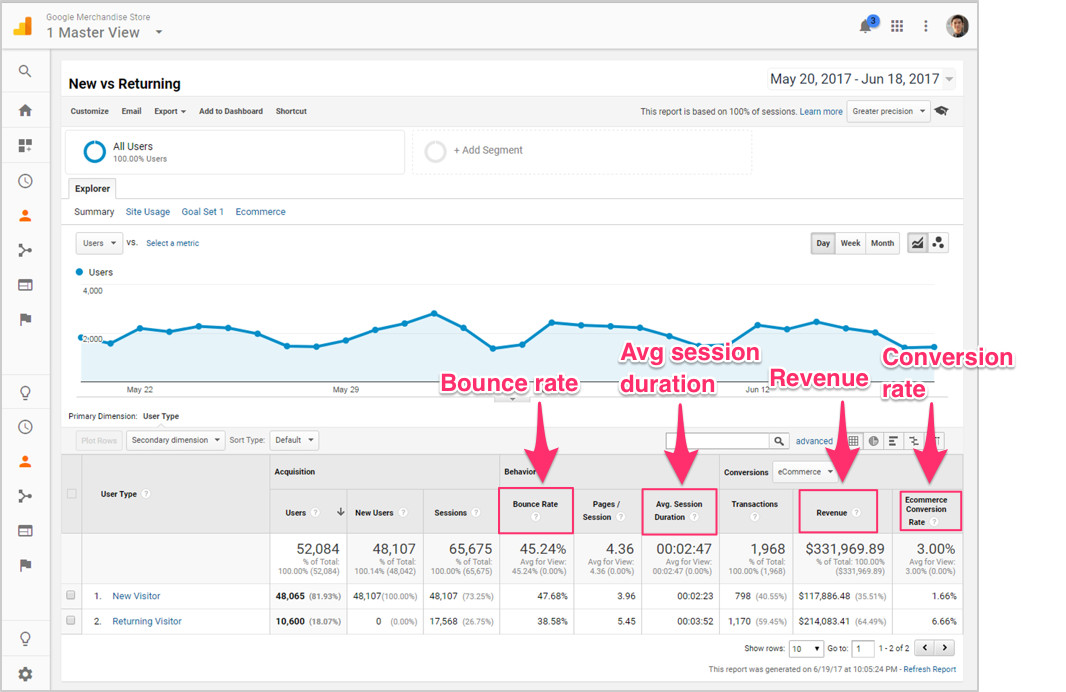
From this report, merchants can view the following online store behavior metrics:
- Bounce rate (by visitor type)
- Average session duration (by visitor type)
- Revenue (by visitor type)
- Conversion rate (by visitor type)
[Source]
Sellers use these four metrics to understand which customer types are the most valuable in terms of revenue and conversions and which types are engaging with the store’s site most frequently. Merchants can apply this knowledge when crafting their messaging to encourage longer store visits and more purchases from buyer groups.
Need a quick review? Here are the metrics we covered in this section:
- Bounce rate (by visitor type)
- Average session duration (by visitor type)
- Revenue (by visitor type)
- Conversion rate (by visitor type)
Acquisition report
The Acquisition report provides insights on how users are arriving at your online store from other channels on the Internet. It’s the third report located on the left-hand sidebar.
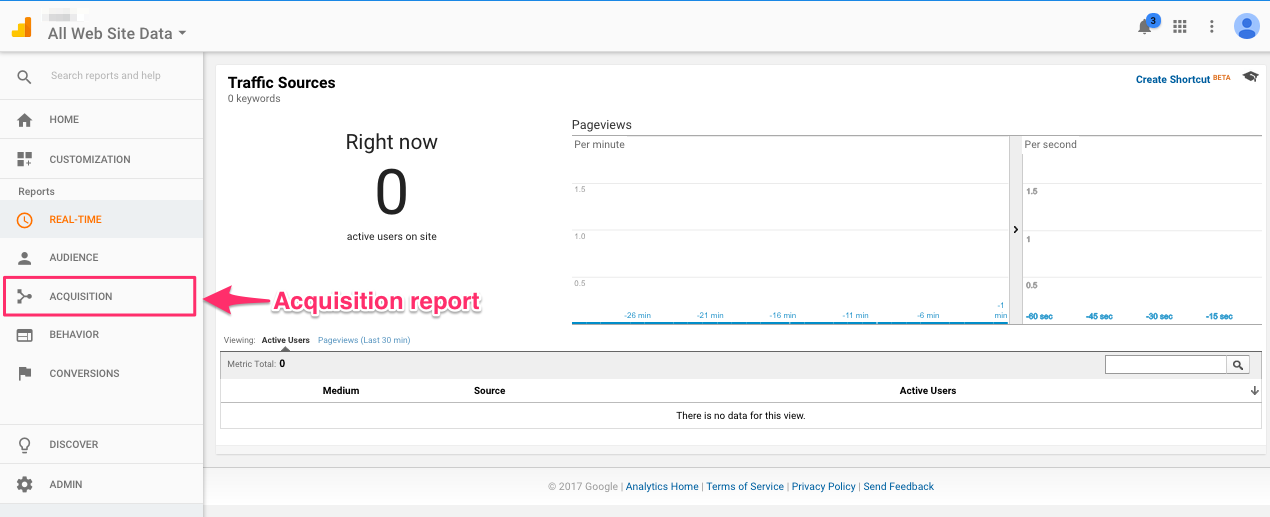
Merchants can find the metrics for the channels customers are using to arrive at your store by visiting the Channels report under the All Traffic section of the Acquisition report.
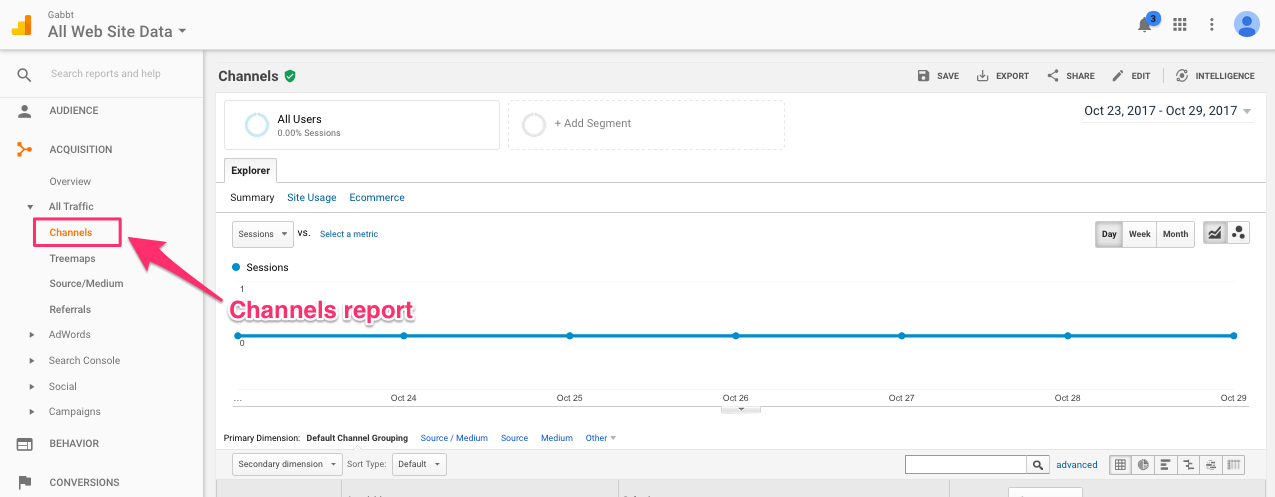
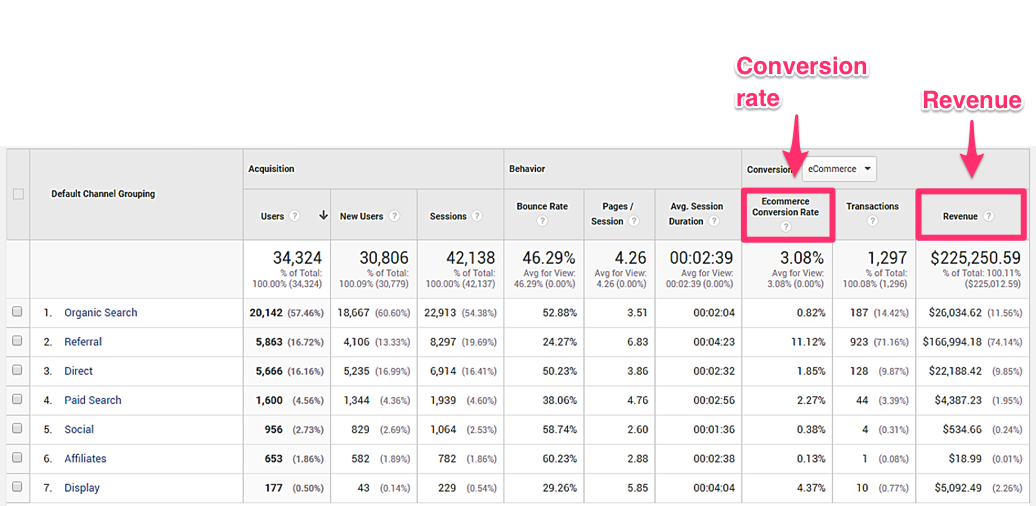
The Channels section includes the conversion rate and revenue metrics for each channel.
[Source]
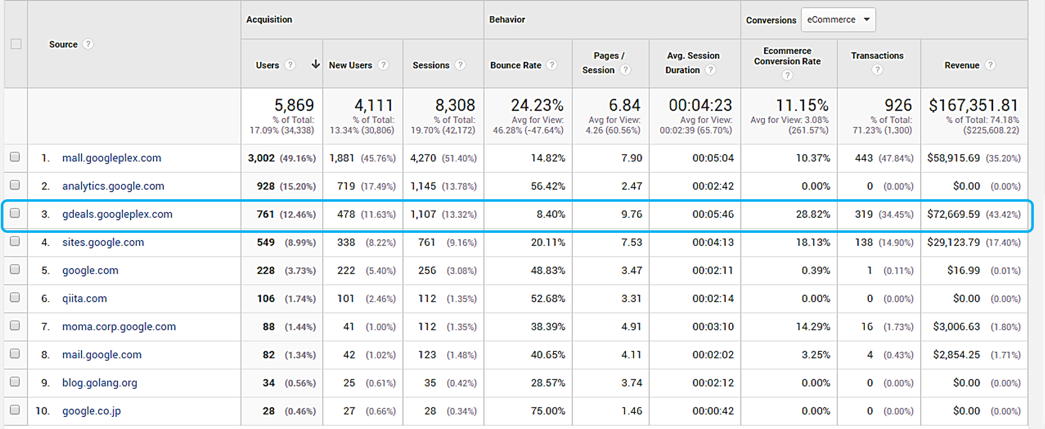
Sellers also have the option of selecting each channel category, such as Organic Search, to view the same metric for individual sources within that channel group.
[Source]
Tracking the conversion rate and revenue metrics allows merchants to determine which channels are performing best, and where to double down marketing efforts.
Need a quick review? Here are the metrics we covered in this section:
- Conversion rate (by channel)
- Revenue (by channel)
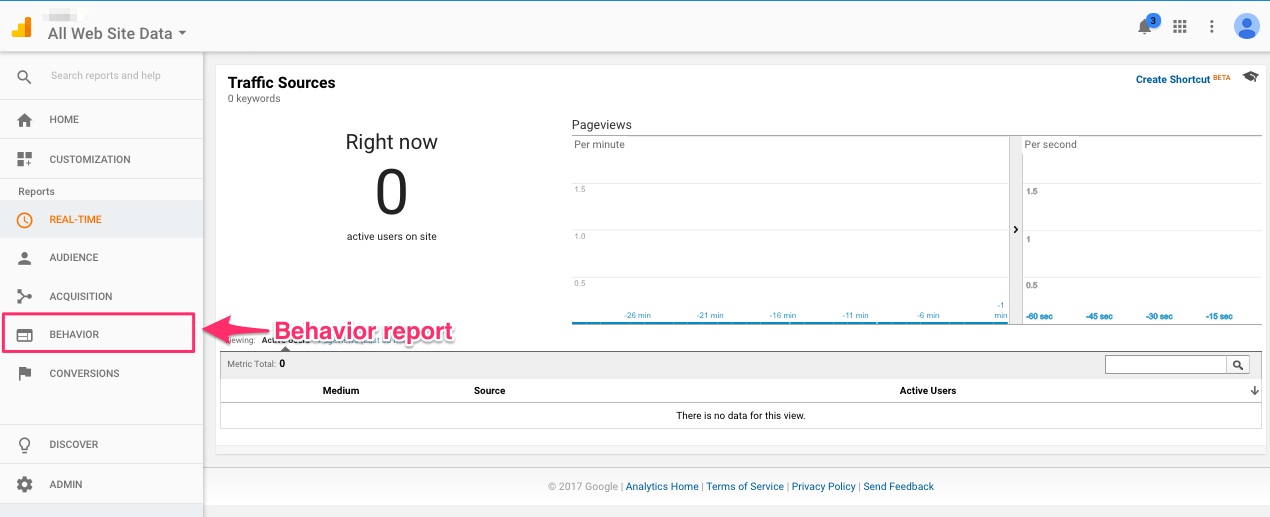
Behavior report
The Behavior report provides insights on users’ experiences on your online store. It’s the fourth report on the left-hand sidebar of Google Analytics.
Merchants can find data on how customers are interacting with their online store pages by clicking the All Pages report under the Site Content section of the Behavior report.
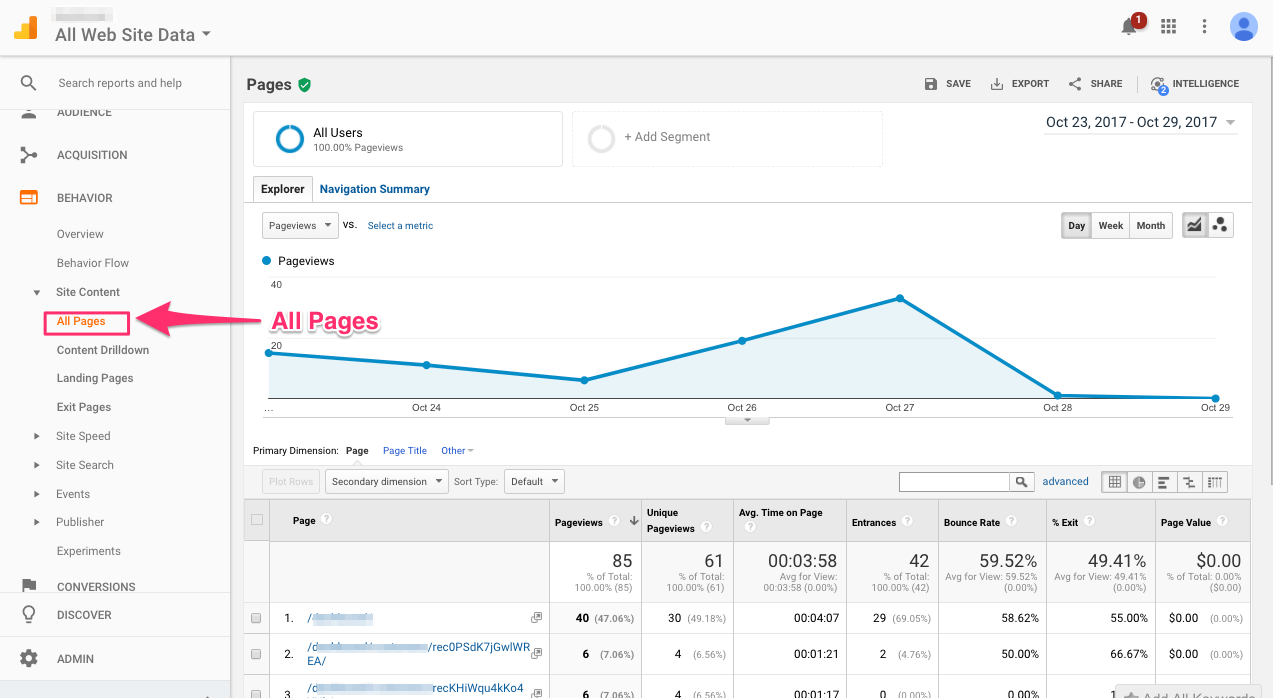
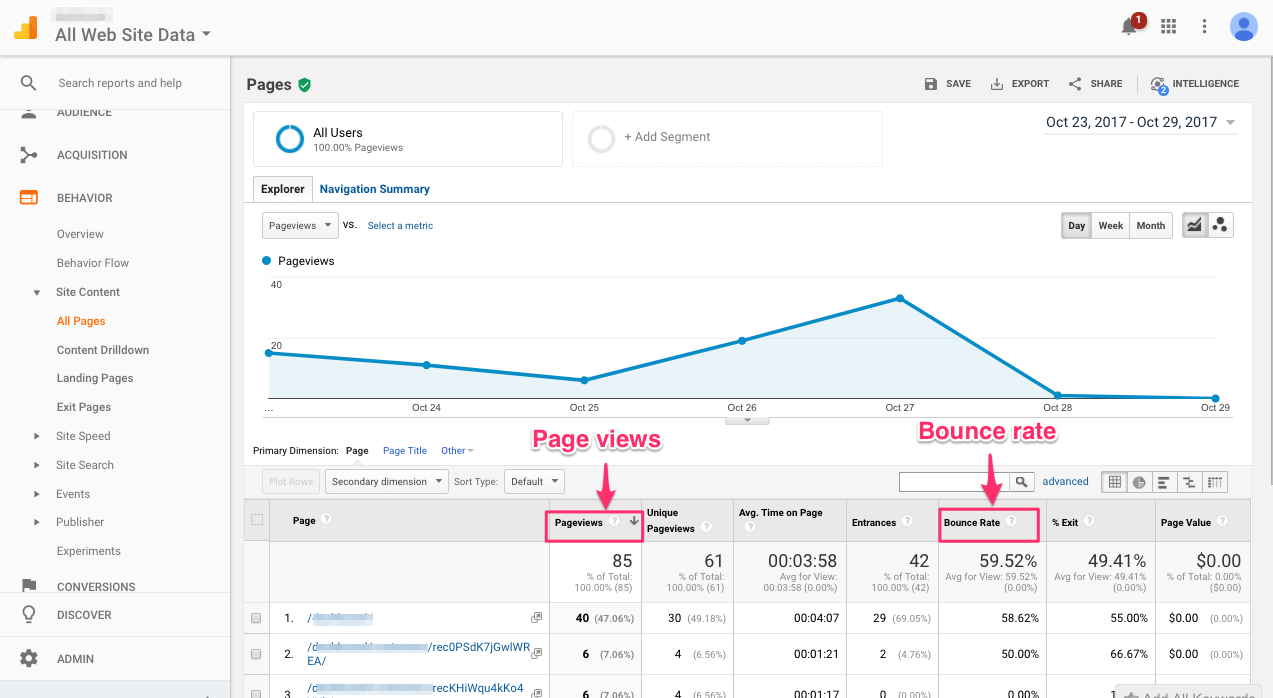
The All Pages section includes the views and bounce rates for each page on your online store.
Sellers can engage customers and encourage more sales by revamping the design of poor-performing pages with low views and high bounce rates.
Need a quick review? Here are the metrics we covered in this section:
- Page views
- Page bounce rate
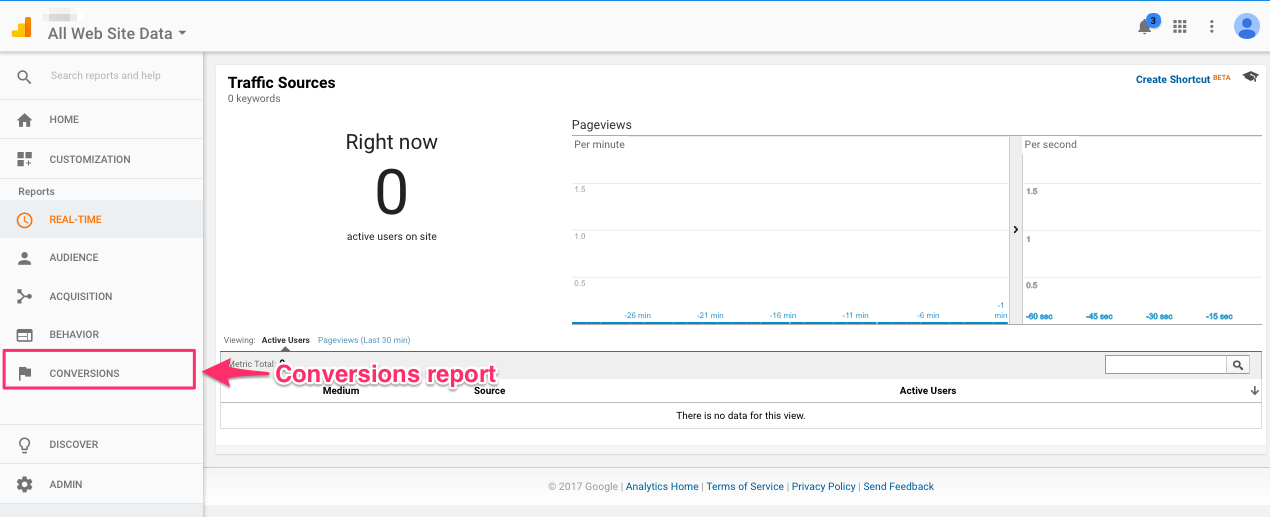
Conversions report
The Conversion report provides data insights for ecommerce merchants on their customers’ shopping behavior and sales performance of their products. It is the fourth report located on the left-hand sidebar of the Google Analytics main view.
Merchants can view shopping behavior metrics by clicking the Shopping Behavior report under the Ecommerce section of the Conversions report.
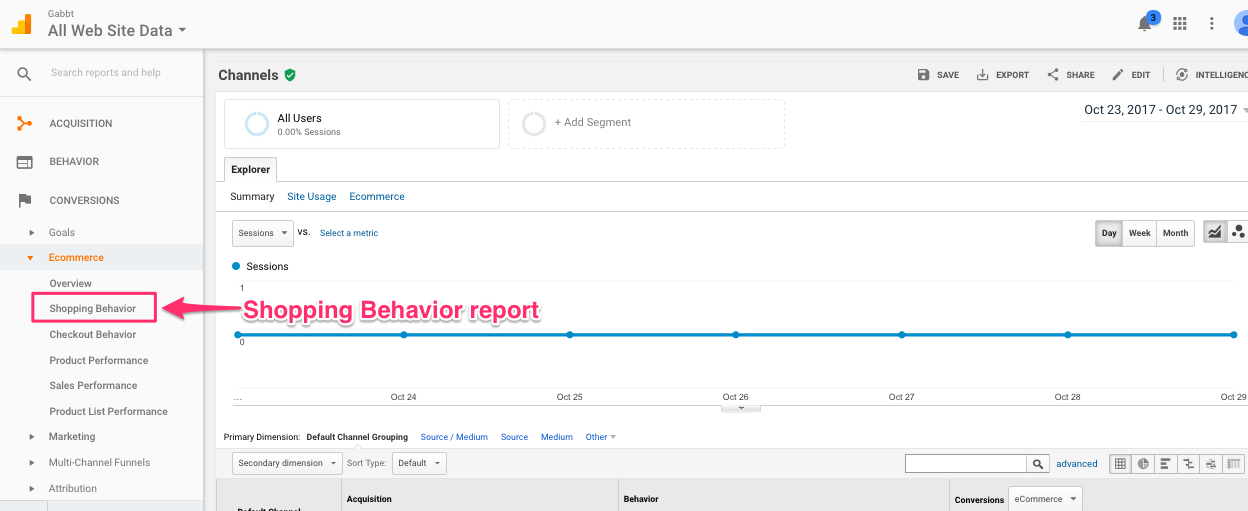
The Shopping Behavior section includes the No Cart Addition, Cart Abandonment, and Check-Out Abandonment metrics.
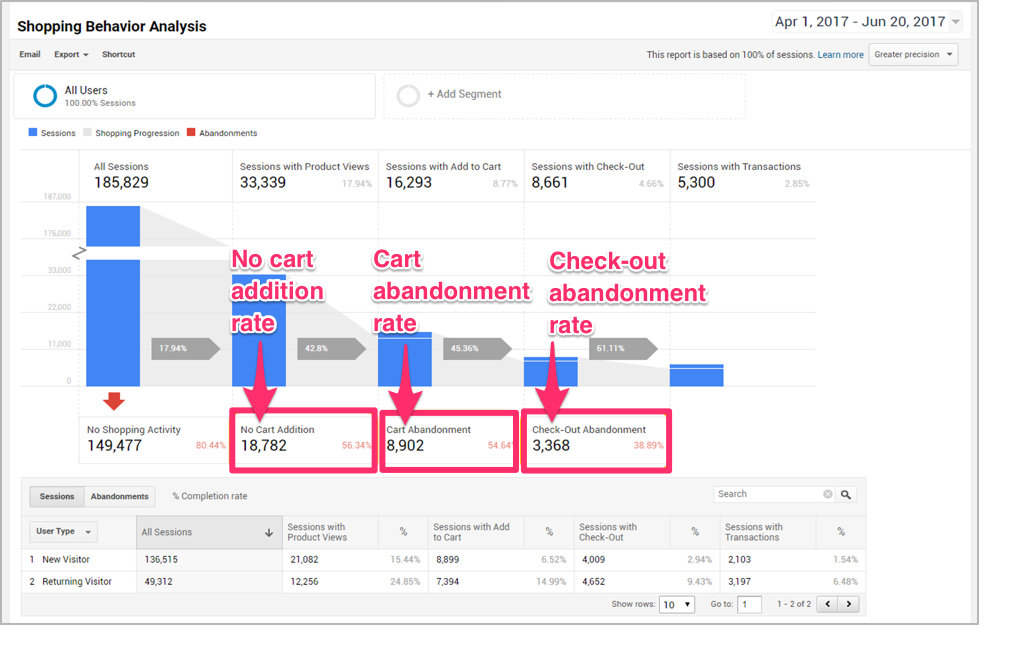
[Source]
Merchants can use these three metrics to assess whether their online store’s cart design, checkout process design, or both need to be improved to encourage more sales.
Sellers can also find product performance metrics under the Product Performance report under the Ecommerce section of the main Conversions report.
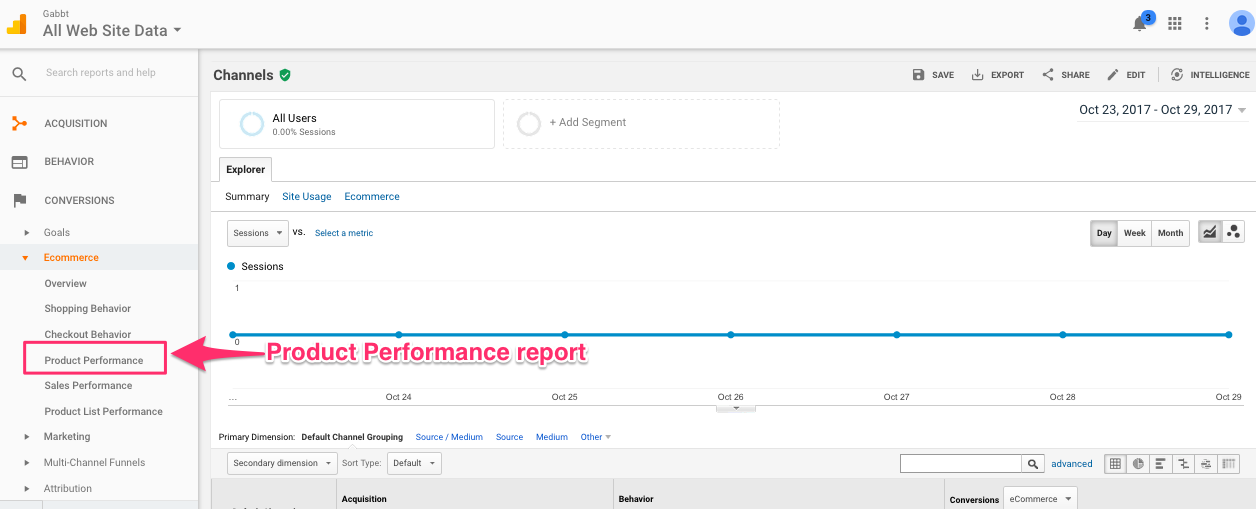
The Product Performance section indicates the cart-to-detail and buy-to-detail rates for each product.
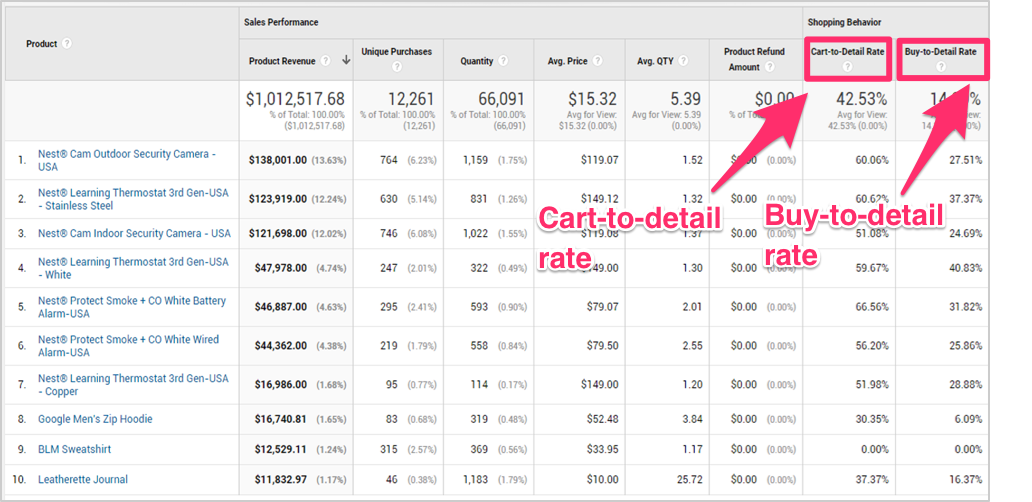
[Source]
These two metrics help sellers assess whether they need to reduce their pricing, including their product prices and their shipping prices, to incentivize purchases from buyers.
Need a quick review? Here are the metrics we covered in this section:
- No cart addition rate
- Cart abandonment rate
- Checkout abandonment rate
- Cart-to-detail rate
- Buy-to-detail rate
Say you want to improve your metrics…
There are no universal benchmarks for Google Analytics metrics since strong performance data is relative to seller and product circumstances.
Merchants instead can judge their metrics based on how they are ranked in their own account. For example, Analytics ranks the channel with the highest revenue from your customers. Sellers can also consider their metric averages over time to set their own data benchmarks.
Merchants who are able to identify whether their metrics are high, low, or average can use these insights to improve their strategies for engaging returning customers and attracting new buyers. We’ve highlighted some tips below for sellers who find that their metrics are at unhealthy levels.
Channel metrics
- If a channel has a low revenue and a low conversion rate: Consider whether the channel is worth targeting with marketing. Most high-growth businesses receive 70-80% of their acquisition from just one channel. Instead of piling on a bunch of channels, it may be more cost-effective to cut back efforts on channels with low revenue and conversion rates. Sellers who believe a poorly performing channel could be a missed opportunity should revise their marketing strategy. They should cater their tactics around attracting potential customers through that specific channel.
Visitor type metrics
- If a visitor type has a high bounce rate and low session duration: Alter your site to attract that visitor type quickly once they enter your online store. Incorporate the specific needs and wants of that buyer group into your messaging to engage them. For example, if new visitors have a higher bounce rate on your store, consider showing a pop-up on your site that promotes a discount for first-time purchases.
- If a visitor type has a low revenue amount and low conversion rate: Consider whether this type is actually a reliable customer that fits one of your business’ buyer personas. If the answer is no, focus your marketing efforts towards the high revenue and high conversion rate visitor types. If you think the poor performing visitor type could be a more valuable buyer group, work on changing your marketing content to target these buyers more effectively.
Page metrics
- If a page has low page views and a high bounce rate: Reevaluate the design of the page. Is it user-friendly? Are there design elements, like a sidebar, that are confusing and discouraging purchases? Also consider whether the content of the page is useful. If it isn’t helpful to your buyers, get rid of the page to avoid having customers lose interest and leave your site.
Order metrics
- If your store has a high no cart addition rate: Consider whether the design of the shopping cart could be more user-friendly. Are customers visiting your product pages but can’t find a discreet Add to Cart button? Also consider whether your product page images could be higher in quality to encourage more visitors to add the item to their cart.
- If your store has a high cart abandonment and checkout abandonment rate: Think about reducing or eliminating some of the last minute checkout page costs, like shipping prices, that could be discouraging buyers from completing their purchase. Also consider whether the design of the checkout page could be improved to be more intuitive and user-friendly. For example, offering a Checkout as Guest option might encourage more sales.
- If a product has a low cart-to-detail rate: Improve the overall appearance of the product page to make it more attractive and effective. Include high-quality clear item photos, avoid cluttering with too much text, and make sure that the average product rating is visible to build buyer trust. Consider whether the item’s price is too high in comparison to competitors’ rates.
- If a product has a low buy-to-detail rate: Improve any design elements of the cart or checkout process that could be discouraging purchases. Also, consider whether the total price of your product (the item price plus its shipping cost) needs to be lowered to compete with other online stores.
Sellers who follow these tips will make their marketing, messaging, store design, and pricing more attractive to buyers and will help eliminate barriers to conversion.
Using Analytics to grow your online store
Online store owners have more autonomy over their customers’ shopping experiences than they would on outside marketplaces, like Amazon, with governing rules and policies. Merchants can take advantage of their level of control by tracking their own data and finding opportunities for improvement.
Utilizing Google Analytics, sellers can track a wide range of metrics on their store activity. Merchants with this knowledge can form data-based insights on how to reshape buyers’ experiences with their brand, products, and store to motivate more purchases from returning and new customers.

1 thought on “Sell Smarter on your Online Store: The Metrics You Need to be Tracking with Google Analytics”
Nice!
Do you why Google Analytics is not tracking my sales from my Etsy shop? All the rest works perfectly but GA ecommerce functionality is not working.
Thanks in advance,